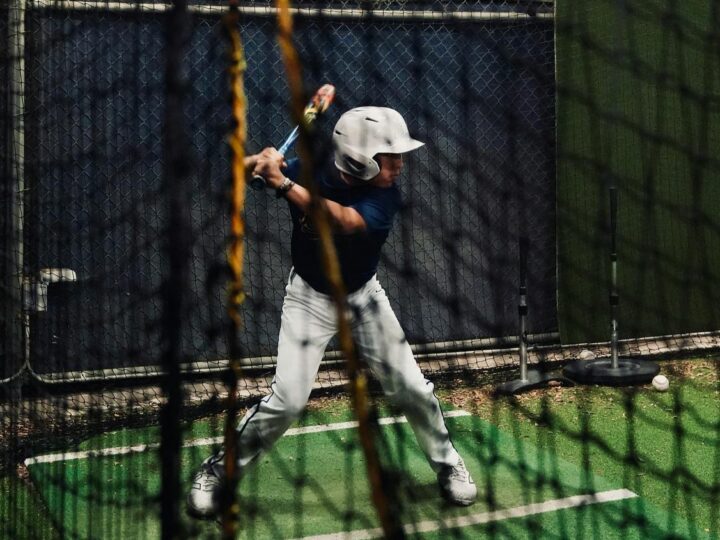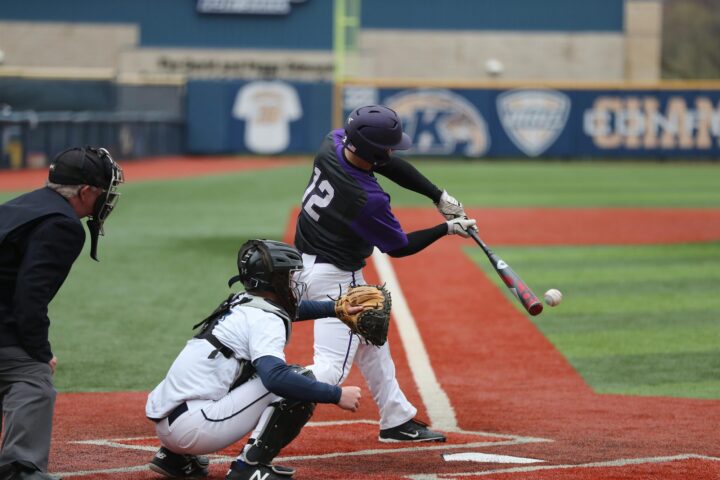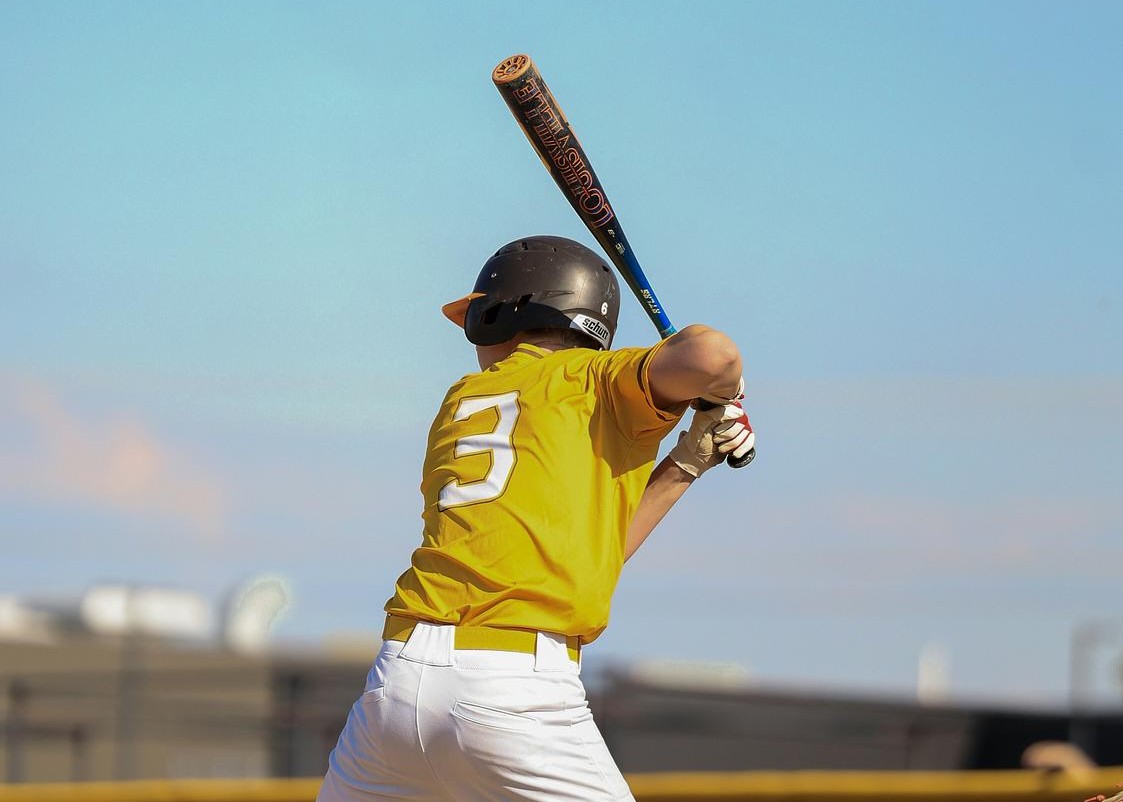
It is 6 p.m., batting practice just wrapped, and you have 22 hitters and a stat screen you have no time to read. High school baseball swing analytics fixes that. You capture every hitter’s swing metrics with a bat-mounted sensor, group players by their biggest metric gap, then hand each group one targeted drill. That is the whole system.
This guide shows you how to build the capture routine, pick the metrics that matter, match each gap to the right drill, prove the spend to your athletic director, and keep it all legal.
1. What Baseball Swing Analytics Actually Means for Your Program
You already know the feeling. Your three-hole hitter crushes it on a tee and disappears against live arms, and you have no shared language to explain why. At the team level, high school baseball swing analytics gives all 22 hitters one language instead of 22 separate gut feelings.
The Blast Baseball sensor mounts on the knob of the bat and pairs with the mobile app to score every swing. Independent research published in the journal Sensors found inertial sensors capture a hitter’s trunk and hand motion with accuracy matching a laboratory motion-capture system, so the numbers you build a program on are real.
Here are the baseball benchmarks your varsity hitters should chase:
| Metric | Target | Reference point |
|---|---|---|
| Bat speed | 60–70 mph (HS varsity) | Pro hitters sit at 66–78 mph |
| Attack angle | 6–14° | MLB average near 8° |
| On-plane efficiency | 70% or higher | MLB average of 68.6% |
| Early Connection | 90° at the Transition Event | Inside an 80–105° range |
| Rotational Acceleration | Higher is better | The 0-60 time of the swing, where high RA becomes game power |
Blast iQ scores each swing and flags green, yellow, and red focus areas, so you read the whole roster at a glance. That team-level view catches the lineup-wide patterns you miss one hitter at a time, like four players all leaking attack angle against the machine. Set a baseline for every player this week.
2. Build Your Two-Week Team Data-Capture System
You cannot halt practice for a biomechanics lab. So fold data capture into the batting practice you already run. That is how Alamo Heights built their rollout in their second season on Blast Baseball.
Take a Blast reading at each BP station:
- Tee for clean mechanics with no timing pressure.
- Soft-toss for rhythm and the early move.
- Front toss for an on-plane path against a live feed.
- Angle-front toss for adjustments to inside and outside pitches.
- Machines for bat speed and timing at game velocity.
Run the rotation for about two weeks. Two weeks of reps gives you a stable baseline instead of one hot or ugly round skewing a player’s profile. Small samples lie, and a single round can send you chasing a problem that was never there.
Then group your roster by biggest gap. Send one group to a bat speed block and another to an attack angle block, exactly how Alamo Heights split their hitters. Now every rep in the cage has a purpose you can name.
3. Pick Your 1–3 Priority Metrics and Kill the Data Overload
Hand a 16-year-old eight metrics and he freezes at the plate. So do you when you try to coach all of them at once.
Blast Baseball tracks bat speed, attack angle, plane, connection, rotation, time to contact, power, and ball flight. That is the full picture for you. A hitter does not need all of it on any given day. Pick one to three priority metrics per player and ignore the rest until those move.
For most high school programs, start here:
- Bat speed, targeting the 60–70 mph varsity band.
- Attack angle, holding 6–14°.
- Rotational Acceleration, your best proxy for game power.
Bat speed leads the list for a reason. Driveline’s reporting on the bat speed wars shows faster swings raise offensive production when contact holds.
Chasing a single number backfires. Tell a kid to shorten his Time to Contact and he often chops down at the ball, tanks his attack angle, and beats everything into the ground. Read the metrics together. A faster swing that drops attack angle to 2° is a worse swing. Fix one gap, confirm the others held, then move to the next.
Ready to put a sensor in every hitter’s hands? Click here to shop Blast Motion.
4. Match the Metric Gap to the Right Drill
A number without a drill is just a complaint. Once you group by gap, hand each group the drill that fixes it.
- When bat speed lags from lost hip-shoulder separation, run the Torque Drill and Knob to Knee Drill to store and release rotation.
- When the barrel casts and leaks away from the body, use the Stop at Contact Drill and coach the cue “Short to it, long through it.”
- When a hitter’s forward move is weak or drifts into a Sway, the Walk Through Drill rebuilds a direct, connected move to the ball.
Re-measure after two weeks in the drill. If bat speed climbs from 62 to 66 mph while attack angle holds inside 6–14°, the fix worked. If the number stalls, change the drill, not the metric.
Keep cues short. Mechanics and mental approach work together, so a hitter running a checklist mid-swing breaks down. For a second set of eyes, pair sensor feedback with AI video from WIN Reality’s SwingAI.
5. Prove the ROI to Your Athletic Director
Your athletic director does not ask about attack angle. He asks what it costs and what it returns. Give him the math.
One Blast Baseball sensor covers a full station, and Blast Connect adds the team reports and Coach Mode layer your staff reads from. Share that sensor across your roster in the BP-station rotation, and your cost per player drops fast across 22 hitters. Budget for the Connect subscription up front, because the data without the coaching layer is far less useful.
Now the return. League batting average falls to about .165 with two strikes, where most at-bats are decided. Cut swing-and-miss with a better attack angle and cleaner connection, and you can add roughly 15 to 20 hits across a season. That is runs, and runs are games.
Track it season over season. Blast player and team reports let you show this year’s bat speed and attack angle against last year’s baseline, so the spend defends itself at budget time. Numbers on a report beat a hunch in a hallway.
6. Stay Legal: Keep Analytics a Practice Tool
Before you outfit the team, get the rule straight. The Blast Baseball sensor is a practice and warm-up tool. It mounts on the knob for cage work, tee work, and pre-game routines, then it comes off for live game at-bats.
Most state high school associations prohibit bat attachments and in-game electronic data. So keep the sensor in the cage and the dugout, not in the box during a sanctioned game. Confirm the specifics with your own state association before your season starts, because rules vary by state and change year to year.
Handled right, analytics stays what it should be, a practice engine that shows up as results on game day. Put the rule in writing for your assistants so nobody guesses.
Supporting Resources
Go deeper on the metrics that move your lineup:
- Learn what a good attack angle in baseball looks like and why 6–14° matters.
- See how on-plane efficiency keeps the barrel in the zone longer.
- Read how to read your Blast Motion app data like a coach, not a spreadsheet.
Build the capture routine. Pick one to three metrics per hitter. Match every gap to a drill, then re-measure across two weeks and one season. Do that, and high school baseball swing analytics stops being a wall of numbers and starts being wins. LIVE swing data. Real progress.