Courtesy of Area Code Games
by giancarlo gil
In baseball, the difference between success and failure can be measured in fractions of an inch or milliseconds. Hitting, in particular, is a skill that requires many moving parts working together in harmony, like a clock.
When high school draft prospects begin the showcase circuit at the start of every summer, they are called to perform in two distinct environments: the showcase setting and in-game. Specifically, they’re called to perform in batting practice and live ABs (In-game) to show off their offensive tools.
While both aim to give an idea of a player’s hitting tools, there are distinct differences in the data generated between these two environments. And because evaluators need to put a projection on these tools, it is essential to understand how to evaluate in each environment.
The Difference in Environments: Batting Practice vs. In-Game
Batting practice has long been a staple on the showcase circuit. BP is a player’s opportunity to show what they can do at the plate and show off traits like raw power, bat-to-ball skills, and ability to manipulate the barrel.
However, while BP does allow evaluators and hitters to get an idea of each tool’s potential, the environment still lacks the context and pressures of real-game scenarios.
BP pitchers are called to throw to the player’s preferred swing zone at slower speeds than in-game, enabling them to anticipate each location and efficiently react to each pitch. In sum, it is a controlled environment where hitters can decide to “sell out” on a pitch they’re anticipating without the risk and stress of in-game situations.
In contrast, in-game data captures a player’s performance in situations that matter most, allowing coaches and players to identify strengths and weaknesses under high-stress conditions. In-game sessions provide an entirely different set of challenges and dynamics of play. Collecting and analyzing a hitter’s in-game data will help outline how well a player uses their abilities.
As a result, combining the two datasets creates space for a better interpretation of a player’s current skillset and if it’s a transferable one to the next level. But more importantly, it highlights what the primary focus should be for the player’s development process.
Earlier this month, we had the opportunity to attend the 2023 Area Code Games hosted by the University of San Diego. Here, we collected data in both environments.
These were our findings:
Top 6 Increases in Bat Speed (BP vs. In-Game)
NOTE: I initially planned on outlining the top 5 players who performed better in-game than in BP, but two players tied for the number 5 spot. I felt that it was essential to recognize both players.
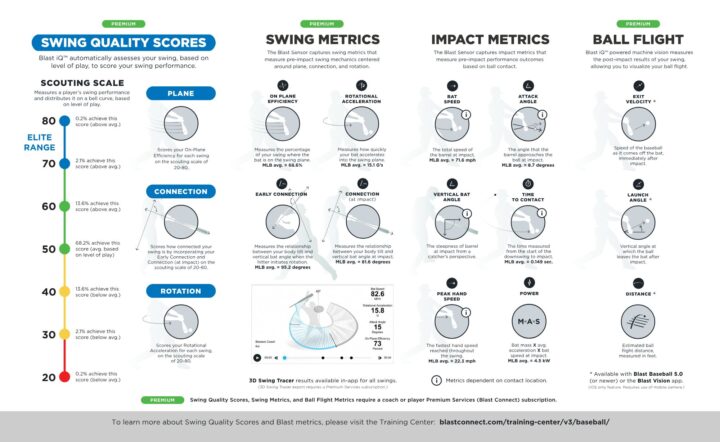
The first metric we’ll look at is Bat Speed.
At Blast, we measure Bat Speed by the peak speed of the barrel at impact. And we measure the barrel six inches from the end of the bat. The value of Bat Speed is self-explanatory.
When evaluating Bat Speed from BP to in-game, we either want to see an increase or consistency. An increase means the player’s swings have more intent than in BP, which they should have because of the environment’s importance. An increase in Bat Speed also suggests that there is a lot more Raw Power that can be extracted from the player.
If the players doesn’t have an increase in Bat Speed during the games, the other characteristic we want to see is consistency. Performing similar Bat Speed values in both BP and in-game can suggest the player has a relatively identical “heartbeat” during non-stress and stress-filled situations.
What we don’t want to see is a significant decrease in “in-game Bat Speed” from “BP Bat Speed.” This would describe what some in the industry might call a five o’clock hitter – someone who only performs well in non-stress situations
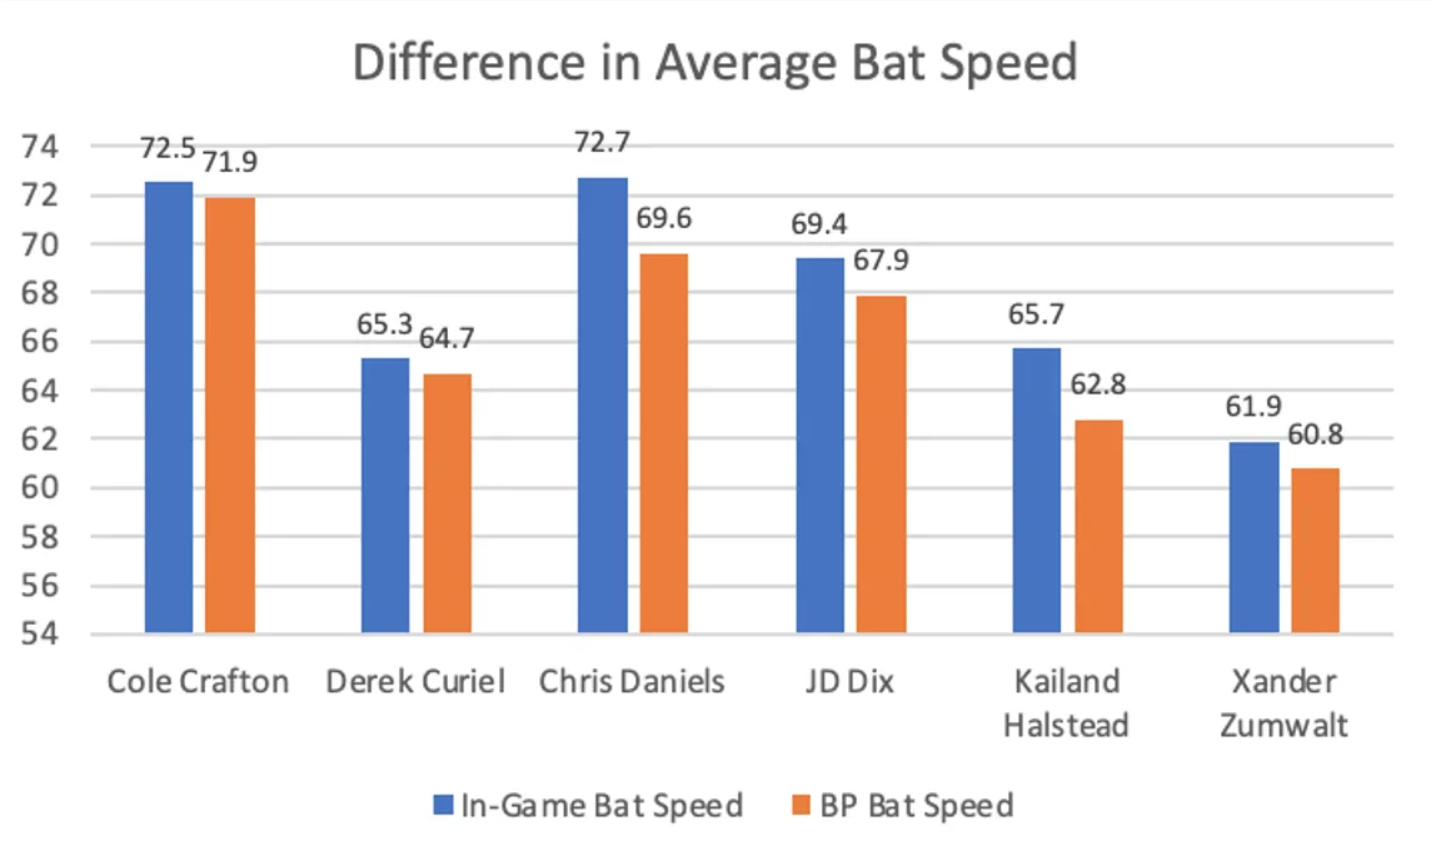
Cole Crafton – White Sox
During game scenarios, the Louisville commit’s Bat Speed measured 0.6 mph faster than in BP scenarios. This suggests that Cole may feel more relaxed and fluid during game scenarios than when trying to showcase his raw ability.
Derek Curiel – Brewers
Like Crafton, Derek also had a 0.6 mph increase in Bat Speed. This consistency points to his ability to maintain his level of composure and that his mechanics transfer fairly well across different settings.
Chris Daniels – Royals
Chris exhibited an impressive 3.1 mph increase in Bat Speed during games. Daniels posted the most significant gain from batting practice to games at Area Codes.
JD Dix – White Sox
JD’s Bat Speed increased by 1.5 mph during games, indicating his capacity to perform at a higher level as competition intensifies.
Kailand Halstead – Royals
The Pacific Northwest’s catcher showed remarkable growth as his Bat Speed increased by 2.9 mph in-game. The significant increase reflects his dedication to development and ability to turn it on when it counts.
Xander Zumwalt – Royals
Rounding out the top 6, Xander steadily improved with his Bat Speed increasing by 1.1 mph during the games.
Top 5 Increases in Rotational Acceleration (BP vs. In-Game)
The other metric we will be looking at is Rotational Acceleration. Rotational Acceleration measures how quickly a player can accelerate into their peak bat speed. So, for example, if two players can swing the bat 75 mph, the player that can reach 75 mph quicker is the player with the higher Rotational Acceleration. As Joe Tourville mentions in this thread, having a high Rotational Acceleration enables the hitter to make later swing decisions at the plate – a quality a hitter must have when he starts to face grade-60 or 70 type pitching repertoires.
Measured in G’s, and like Bat Speed, the higher the Rotational Acceleration the better.
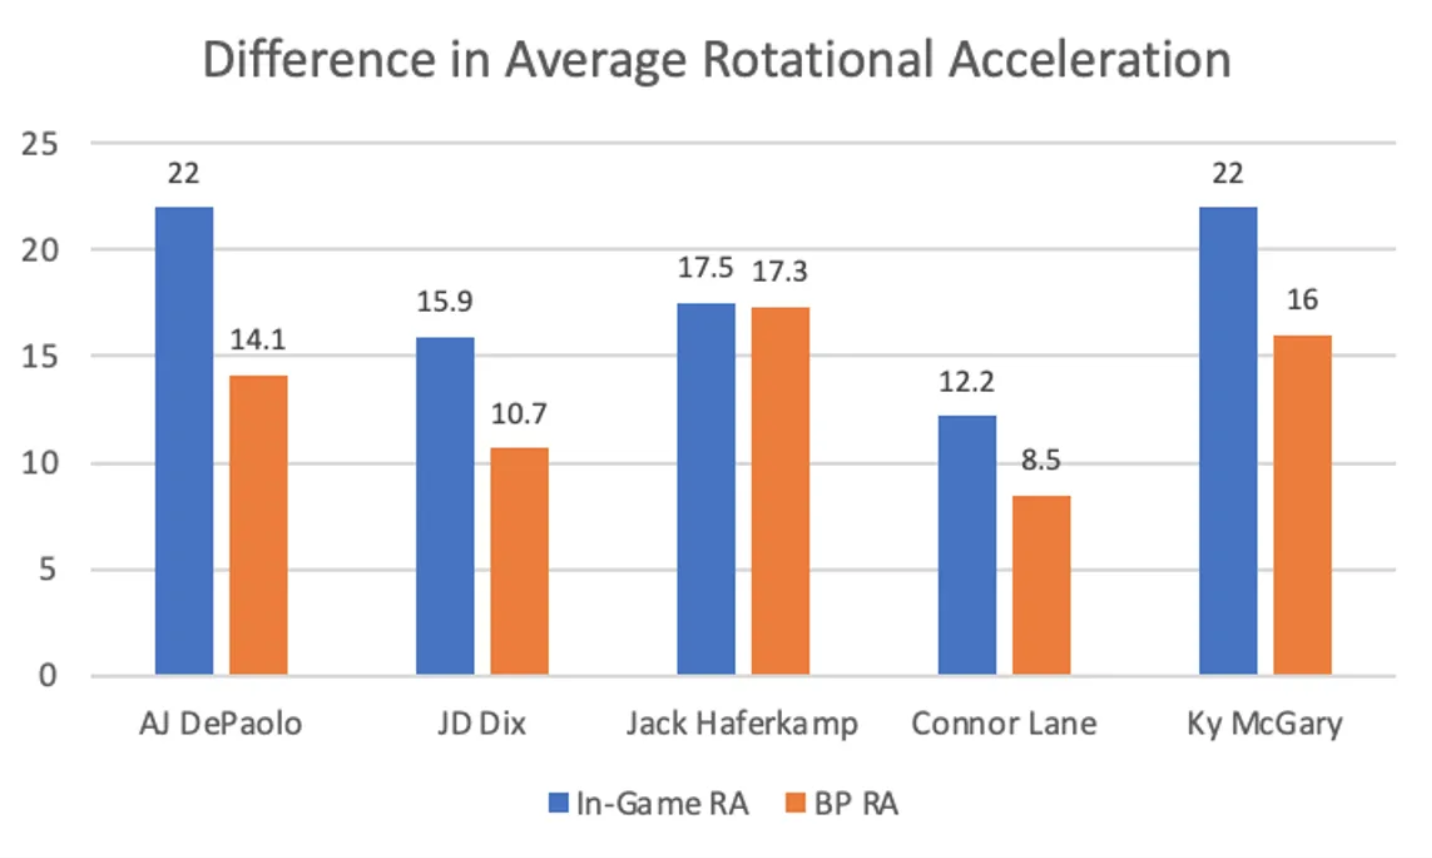
AJ DePaolo – Rangers
With an astonishing 7.9 g increase, AJ performed significantly better in-game. DePaolo posted an average of 22 g’s in-game and reached a peak of 28 g’s. The Vanderbilt commit displayed his remarkable ability to generate more power and Bat Speed when facing live pitching.
JD Dix – White Sox
JD showed noticeable improvement in his Rotational Acceleration, registering a substantial 5.2 g increase from his batting practice performance. This uptick suggests his skillset is better suited to adapting to the many different variables he may face in a game.
Jack Haferkamp – Brewers
The most consistent between in-game and BP, Haferkamp only showed a 0.2 g difference between the two environments. While this may seem insignificant, the data suggests that Haferkamp possesses easy, repeatable mechanics that translate well from one environment to another.
Connor Lane – Yankees
Connor displayed a respectable 3.7 g increase in RA throughout the week. The UCONN catching commit’s peak RA was on par with his average and can translate to the collegiate level.
Ky McGary – Reds
The final entrant on our list, Ky demonstrated a significant increase of 6 g’s in Rotational Acceleration during games. This suggests that McGary excels under the circumstances of competitive play.
_______________________________
Understanding the differences between batting practice and in-game data is essential for coaches and players. By solely evaluating the BP data from the Area Code Games, it could have been possible to prematurely write a player off because he didn’t perform his best or display his full potential. Having both sides of the picture gives important context when evaluating a player.
On the development side, coaches can develop and tailor training plans to address specific challenges posed by live-game situations. At the same time, players can use this knowledge to bridge the gap between practice and in-game results. As technology continues to advance, the ability to capture and analyze hitting data from both environments will continue to offer deep insights into player development.